Which KPIs Matter Most to Banks in Credit Underwriting?
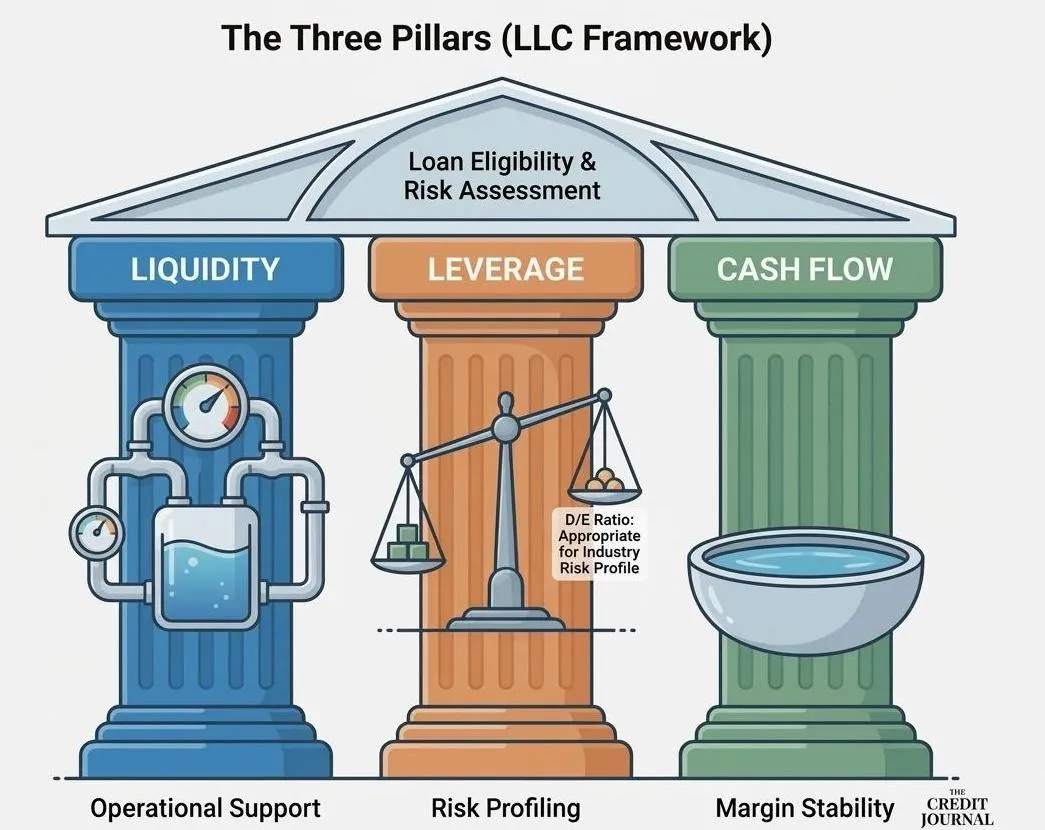
The Three Pillars of Credit Analysis: LLC - Liquidity, Leverage & Cash Flow
In accounting and finance, KPIs — Key Performance Indicators — measure performance. Management uses them to steer strategy, monitor profitability, and evaluate growth.
When you walk into a bank seeking financing, the financial story you tell must be interpreted through a risk lens. The indicators that signal operational success to an entrepreneur do not always carry the same meaning to a credit officer. What looks like aggressive growth to an owner may look like expanding exposure to a lender.
Industry matters. Lenders use them differently.
Business model matters. Capital structure matters.
Business owners typically track KPIs that measure profitability, enterprise value, and long-term strategic growth. Lenders, however, evaluate metrics through a different lens — one centered on risk mitigation and repayment capacity.
At its core, credit underwriting seeks to answer a handful of fundamental questions:
Is the business consistently profitable?
Is cash flow sufficient to service debt – currently and under stress?
Are margins stable, improving, or eroding?
Is working capital adequate to support operations?
Is leverage appropriate for the risk profile?
Nearly every bank analysis ultimately converges on three pillars: Liquidity. Leverage. Cash Flow. I refer to this framework simply as LLC.
In this article, we’ll examine the KPIs and financial metrics that matter most to banks and credit unions — and how business owners and real estate operators can proactively align their financial narrative before submitting a loan request.
Liquidity: The Foundation of Short-Term Stability
Liquidity measures a company’s ability to meet obligations due within one year. It begins with working capital:
Working Capital = Current Assets – Current Liabilities
From there, lenders analyze the Current Ratio (Current Assets/Current Liabilities) and Quick Ratio (Liquid Assets/Current Assets) to evaluate short-term coverage. Stronger ratios generally indicate greater flexibility to manage payroll, rent, supplier obligations, and short-term debt.
But experienced lenders know that liquidity is not defined by ratios alone.
Two businesses may report the same Current Ratio of 2.0:1 and yet present very different levels of risk. Consider a grocery store and a jewelry retailer. The grocery store may turn its inventory every two weeks. The jeweler may turn inventory only twice per year. On paper, the ratios look identical. In reality, the grocery store converts merchandise into cash far more rapidly, meaning its liquidity risk is materially lower.
This is where the Cash Conversion Cycle (CCC) becomes critical. Banks evaluate how long it takes for a business to convert cash outlays into collected cash. A shorter cycle reduces strain on working capital. A longer cycle increases financing need and vulnerability during growth or margin compression.
Liquidity, therefore, is not simply what sits on the balance sheet — it is how quickly that balance sheet moves.
This concept becomes even more important for commercial contractors managing work-in-process and retainage, manufacturers balancing production cycles and receivable lags, wholesalers carrying bulk inventory, and real estate developers navigating long project timelines. In these businesses, working capital efficiency — not just working capital size — determines financial resilience.

Liquidity is not just about ratios – it is about velocity.
Asset Quality and Efficiency Ratios
This is where asset quality analysis becomes critical. Banks evaluate how efficiently a company manages its working capital through Efficiency Ratios.
For working capital, the primary measures include:
Accounts Receivable Turnover: Net Sales ÷ Average Accounts Receivable
Measures how quickly receivables are collected.
Inventory Turnover: Cost of Goods Sold ÷ Average Inventory
Measures how quickly inventory converts into sales.
Accounts Payable Turnover: Cost of Goods Sold ÷ Average Accounts Payable
Measures how quickly the company pays suppliers.
In each case, higher turnover ratios generally indicate faster “turn” of balance sheet items — and therefore stronger operating efficiency and liquidity.
When Banks underwrite working capital lines of credit, they look at average days on hand, which is calculated from the efficiency ratios, to also measure the financing gap – the periods between a business’s cash outlay and cash inflow (collections), illustrated as follows:
")
From a bank’s perspective:
A short CCC = faster cash recovery, lower liquidity risk
A long CCC = greater working capital strain, higher financing need
A rapidly expanding CCC during growth = requires influx of capital.
Leverage: Structural Risk in the Capital Model
If liquidity answers whether a company can survive the short term, leverage answers how much structural risk is embedded in the business model.
Banks evaluate leverage from two perspectives: the balance sheet and the income statement.
On the balance sheet, the primary measure is Debt-to-Net Worth, which compares total liabilities to tangible equity. This ratio measures how many dollars of debt support each dollar of owner capital. Higher leverage increases sensitivity to revenue declines, margin compression, interest rate increases, and asset value fluctuations. More equity provides a protective cushion. More debt magnifies outcomes — positively in good times, negatively in downturns.

Given similar circumstance, a bank would consider Company C a greater risk than Company A, meaning Company C has significantly more financial leverage than A. As leverage increases, the company becomes more sensitive to:
Revenue declines
Margin compression
Interest rate increases
Asset value fluctuations
Asset and cash conversion disruptions
Higher leverage magnifies returns in good times — but accelerates losses in downturns. In addition, the greater a company’s leverage, the more susceptible it becomes to changes in the velocity of working capital turn. The stronger the equity base, the greater the cushion protecting the bank. In other words, more equity equates to “more skin in the game” by the business owners.
However, leverage must be evaluated within industry context. Real estate investors, hospitality operators, and developers often operate with higher long-term leverage supported by income-producing property. Capital-intensive contractors and transportation companies may carry significant equipment financing structured over useful asset lives. In each case, the underwriting focus shifts from absolute leverage to whether the structure aligns with sustainable cash flow.
There is also an inherent tension between owners and lenders regarding leverage. From an ownership perspective, financial leverage can enhance Return on Equity. When returns exceed the cost of debt, leverage increases shareholder returns. Yet lenders prioritize durability over optimization. More equity reduces risk, even if it dilutes returns.
This difference is not a conflict — it is a balancing act between efficient capital structure and sustainable capital structure.
Operating leverage introduces a second dimension. Businesses with high fixed costs — rent, salaries, leases, debt service — require higher revenue levels to break even. When revenue declines, fixed expenses remain. Profitability compresses quickly. When high financial leverage combines with high operating leverage, risk compounds. That combination receives close scrutiny in any prudent underwriting process.
Leverage is not simply about how much debt exists. It is about how much pressure that debt places on future cash flow.
Cash Flow: The Ultimate Credit Test
Liquidity supports operations.
Leverage defines structural risk.
Cash flow repays loans.
For lenders, this is the decisive metric.
Most credit analysis begins with EBITDA — Earnings Before Interest, Taxes, Depreciation, and Amortization. EBITDA measures core earning power before financing decisions. But sophisticated underwriting does not stop there.
Banks adjust for non-recurring items and normalize earnings. More advanced credit analysis applies the Uniform Credit Analysis (UCA) framework, which reconciles net income to actual cash generation by incorporating changes in working capital, capital expenditures, debt repayments, and owner distributions.
EBITDA reflects earnings power.
UCA reflects cash reality.
A business may report strong profitability yet experience cash strain due to rapid receivable growth, inventory expansion, capital investment, or shareholder withdrawals. That distinction matters greatly to lenders.
The central repayment metric remains the Debt Service Coverage Ratio (DSCR) — cash flow divided by total debt service. A DSCR of 1.20x provides modest cushion. A stronger 1.35x or higher offers greater resilience. Banks frequently stress-test this ratio under scenarios of reduced revenue, margin compression, or rising interest rates. In real estate underwriting, vacancy and expense assumptions are similarly stressed.
Another critical measure is Funded Debt to EBITDA, which answers a simple but powerful question: how many years of current earnings would it take to repay funded debt? This ratio directly links leverage to earning capacity. If EBITDA declines, leverage rises immediately — even without additional borrowing. That dynamic lies at the heart of credit risk assessment.
Ultimately, lenders focus not on peak earnings but on durability. Revenue diversification, margin stability, capital expenditure needs, working capital demands, and industry cyclicality all factor into evaluating whether cash flow can withstand volatility.
Profitability may build enterprise value — but sustainable cash flow repays debt.
The LLC Framework
Every sound credit decision converges on three pillars:
Liquidity measures short-term resilience.
Leverage measures structural risk.
Cash Flow measures repayment capacity.
When these three align, a company becomes not just profitable — but bankable.

Final Perspective
Business owners and real estate investors and developers measure performance to grow, returns and enterprise or project value.
Lenders measure performance to assess risk including repayment capacity and durability.
Access to capital requires translating your financial narrative into the language of Liquidity, Leverage, and Cash Flow. When entrepreneurs understand how banks evaluate these pillars, loan discussions shift from reactive defense to proactive positioning.
And that alignment often determines whether a credit request is approved, declined — or delayed.
Strategic performance builds value.
Credit discipline secures capital.